October 2026 data · 50 suburbs
Melbourne Eastern Suburbs house prices map: median price by suburb
Median house and unit prices for 50 suburbs across Box Hill, Doncaster, Glen Waverley, Kew and Camberwell, from REA sales data for October 2026. The typical Melbourne Eastern Suburbs suburb has a median house price of $1.50m and a median unit price of $846k. Open the interactive map to see every suburb coloured by price and compare suburbs side by side.
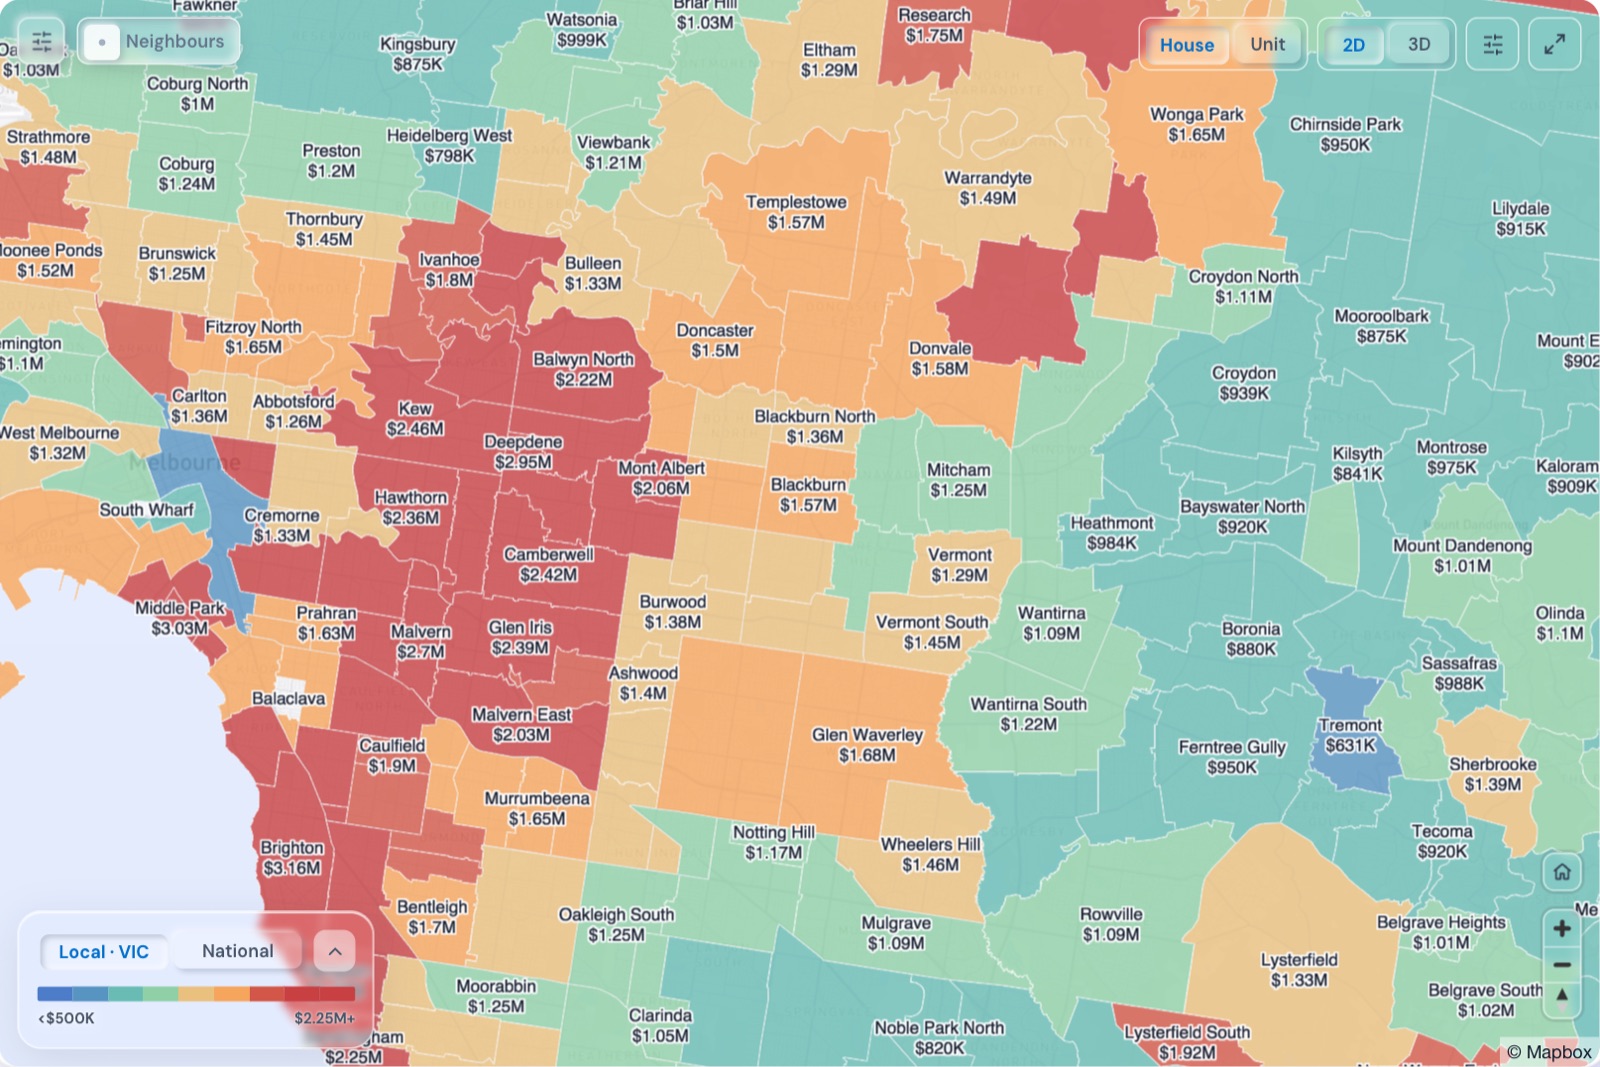
Most expensive and most affordable Melbourne Eastern Suburbs suburbs
Ranked by median price among suburbs with a reported median in October 2026. Suburbs with few sales can move a lot from month to month.
Highest median house prices
- Canterbury $3.13m
- Deepdene $2.95m
- Balwyn $2.67m
- Warrandyte South $2.47m
- Hawthorn East $2.46m
- Kew $2.46m
- Camberwell $2.42m
- Glen Iris $2.39m
- Hawthorn $2.36m
- Kew East $2.26m
Lowest median house prices
- Mulgrave $1.08m
- Notting Hill $1.17m
- Nunawading $1.18m
- Forest Hill $1.18m
- Clayton $1.19m
- Oakleigh East $1.22m
- Oakleigh South $1.25m
- Mitcham $1.25m
- Huntingdale $1.26m
- Chadstone $1.28m
Highest median unit prices
- Balwyn North $1.32m
- Wheelers Hill $1.21m
- Mount Waverley $1.09m
- Ashburton $1.08m
- Wonga Park $1.07m
- Mont Albert North $1.06m
- Ashwood $1.05m
- Canterbury $1.02m
- Vermont South $1.02m
- Camberwell $995k
Lowest median unit prices
- Notting Hill $432k
- Warrandyte $486k
- Box Hill $500k
- Oakleigh $549k
- Hawthorn $582k
- Hawthorn East $625k
- Clayton $631k
- Doncaster $632k
- Burwood East $668k
- Glen Iris $710k
Median prices and growth by suburb
Median prices and growth come from REA sales data for October 2026, for all bedroom counts.3 mo, 6 mo and 12 mo compare the median price with three, six and twelve months earlier. Medians cover sales over the past 12 months, so changes move more slowly than monthly index reports.Suburbs with only a few sales can show big swings, so read large changes with care.Every Melbourne Eastern Suburbs suburb with a reported median price in October 2026, with the change over 3, 6 and 12 months. Pick a council to narrow the list, and select a column heading to sort. A dash means no reported figure.
| House | Unit | ||||||||
|---|---|---|---|---|---|---|---|---|---|
| Boroondara | Ashburton | $1.95m | ▼ −1.3% | ▼ −1.5% | ▲ +2.2% | $1.08m | ▲ +8.2% | ▼ −8.5% | ▼ −12.2% |
| Monash | Ashwood | $1.40m | ▼ −4.6% | ▼ −9.4% | ▼ −7.5% | $1.05m | ▲ +6.1% | ▲ +5.5% | ▲ +11.7% |
| Boroondara | Balwyn | $2.67m | ▼ −0.6% | ▼ −7.0% | ▼ −8.1% | $839k | ▼ −2.0% | ▼ −1.4% | ▲ +3.3% |
| Boroondara | Balwyn North | $2.22m | ▼ −3.6% | ▼ −4.7% | ▼ −5.7% | $1.32m | ▲ +16.1% | ▲ +18.6% | ▲ +14.2% |
| Whitehorse | Blackburn | $1.57m | ▼ −1.8% | ▼ −3.6% | ▼ −1.8% | $743k | ▼ −3.0% | ▼ −7.2% | ▼ −5.4% |
| Whitehorse | Blackburn North | $1.36m | ▼ −2.4% | ▼ −3.6% | ▲ +1.2% | $930k | ▲ +1.1% | ▲ +4.9% | ▲ +17.5% |
| Whitehorse | Blackburn South | $1.34m | ▼ −1.3% | ▼ −2.3% | ▼ −2.8% | $881k | ▼ −9.2% | ▼ −2.1% | ▼ −5.8% |
| Whitehorse | Box Hill | $1.58m | ▼ −4.0% | ▼ −5.7% | ▼ −6.7% | $500k | ▼ −0.4% | ▼ −1.0% | ▼ −6.9% |
| Whitehorse | Box Hill North | $1.31m | ▼ −5.7% | ▼ −6.1% | ▼ −5.4% | $819k | ▼ −9.0% | ▼ −12.7% | ▼ −11.2% |
| Whitehorse | Box Hill South | $1.43m | ▼ −1.7% | ▼ −5.7% | ▼ −1.2% | $860k | ▲ +0.5% | ▼ −4.8% | ▼ −6.0% |
| Manningham | Bulleen | $1.33m | ▼ −1.5% | ▼ −3.1% | ▼ −1.5% | $814k | ▲ +2.4% | ▼ −4.2% | ▼ −6.2% |
| Whitehorse | Burwood | $1.38m | ▼ −2.5% | ▼ −4.8% | ▼ −8.1% | $814k | ▼ −1.2% | ▼ −6.1% | ▲ +1.8% |
| Whitehorse | Burwood East | $1.31m | ▼ −2.6% | ▼ −2.6% | ▼ −0.4% | $668k | ▼ −0.1% | ▲ +0.6% | ▲ +6.0% |
| Boroondara | Camberwell | $2.42m | ▼ −4.3% | ▼ −5.1% | ▼ −7.3% | $995k | ▲ +6.3% | ▲ +0.8% | ▲ +10.6% |
| Boroondara | Canterbury | $3.13m | ▼ −2.4% | ▼ −15.3% | ▼ −16.7% | $1.02m | ▼ −13.3% | ▼ −12.4% | ▼ −10.1% |
| Monash | Chadstone | $1.28m | ▼ −3.2% | ▼ −3.9% | ▲ +0.8% | $865k | ▲ +0.2% | ▼ −0.9% | ▲ +8.3% |
| Monash | Clayton | $1.19m | ▼ −7.6% | ▼ −8.8% | ▼ −10.2% | $631k | ▼ −10.5% | ▼ −15.9% | ▼ −9.3% |
| Boroondara | Deepdene | $2.95m | ▼ −5.6% | ▼ −10.6% | ▼ −14.5% | $981k | ▲ +8.8% | ▼ −10.8% | ▼ −11.1% |
| Manningham | Doncaster | $1.50m | ▼ −2.0% | ▼ −3.2% | 0.0% | $632k | ▲ +0.8% | ▲ +0.3% | ▲ +6.2% |
| Manningham | Doncaster East | $1.50m | ▼ −5.9% | ▼ −6.5% | ▼ −4.1% | $822k | ▼ −2.4% | ▼ −1.0% | ▼ −7.7% |
| Manningham | Donvale | $1.58m | ▼ −4.6% | ▼ −3.2% | ▲ +1.1% | $829k | ▼ −2.3% | ▼ −1.6% | ▲ +3.0% |
| Whitehorse | Forest Hill | $1.18m | ▼ −3.7% | ▼ −3.5% | ▼ −2.7% | $848k | ▲ +5.9% | ▲ +8.0% | ▲ +10.8% |
| Boroondara | Glen Iris | $2.39m | ▼ −2.3% | ▼ −8.6% | ▼ −3.4% | $710k | ▼ −1.2% | ▲ +2.2% | ▲ +4.4% |
| Monash | Glen Waverley | $1.68m | ▼ −3.8% | ▼ −5.2% | ▼ −1.6% | $883k | ▼ −5.4% | ▼ −2.5% | ▼ −5.1% |
| Boroondara | Hawthorn | $2.36m | ▼ −14.6% | ▼ −15.6% | ▼ −20.7% | $582k | ▼ −1.2% | ▲ +1.9% | ▲ +1.2% |
| Boroondara | Hawthorn East | $2.46m | ▼ −0.8% | ▼ −1.4% | ▼ −3.3% | $625k | ▼ −1.1% | ▲ +1.6% | ▲ +1.1% |
| Monash | Hughesdale | $1.65m | 0.0% | ▲ +5.0% | ▲ +12.7% | $723k | ▲ +1.0% | ▲ +4.2% | ▲ +3.2% |
| Monash | Huntingdale | $1.26m | ▼ −5.7% | ▼ −0.5% | ▼ −2.6% | $771k | ▲ +30.7% | 0.0% | ▲ +10.1% |
| Boroondara | Kew | $2.46m | ▼ −1.9% | ▼ −3.1% | ▼ −6.4% | $887k | ▲ +4.1% | ▲ +0.2% | ▲ +10.9% |
| Boroondara | Kew East | $2.26m | ▼ −2.2% | ▼ −1.7% | ▲ +2.7% | $915k | ▼ −10.4% | ▼ −2.1% | ▼ −4.1% |
| Whitehorse | Mitcham | $1.25m | 0.0% | ▲ +0.2% | ▲ +4.1% | $844k | ▼ −1.6% | ▼ −1.9% | ▲ +5.5% |
| Whitehorse | Mont Albert | $2.06m | ▼ −11.6% | ▼ −14.8% | ▼ −17.7% | $808k | ▲ +1.3% | ▼ −0.1% | ▼ −0.9% |
| Whitehorse | Mont Albert North | $1.59m | ▼ −10.5% | ▼ −9.5% | ▼ −6.5% | $1.06m | ▼ −16.3% | ▼ −18.6% | ▼ −18.6% |
| Monash | Mount Waverley | $1.56m | ▼ −3.5% | ▼ −5.5% | ▼ −5.7% | $1.09m | ▼ −0.6% | ▼ −4.5% | ▼ −0.6% |
| Monash | Mulgrave | $1.08m | ▼ −3.6% | ▼ −4.4% | ▼ −2.3% | $820k | ▼ −5.8% | ▼ −4.7% | ▼ −4.2% |
| Monash | Notting Hill | $1.17m | ▼ −0.7% | ▼ −0.3% | ▼ −1.7% | $432k | ▼ −0.9% | ▲ +9.2% | ▲ +14.2% |
| Whitehorse | Nunawading | $1.18m | ▼ −1.4% | ▼ −1.6% | ▲ +3.4% | $815k | ▲ +3.8% | ▲ +3.8% | ▲ +8.6% |
| Monash | Oakleigh | $1.35m | ▼ −2.9% | ▼ −2.9% | ▲ +1.5% | $549k | ▼ −5.3% | ▼ −5.3% | ▼ −4.1% |
| Monash | Oakleigh East | $1.22m | ▲ +0.4% | ▲ +2.0% | ▲ +3.9% | $875k | ▲ +1.9% | ▲ +0.6% | ▼ −1.4% |
| Monash | Oakleigh South | $1.25m | ▼ −0.2% | ▼ −1.0% | ▲ +5.5% | $785k | ▼ −6.0% | ▼ −9.2% | ▲ +2.0% |
| Manningham | Park Orchards | $2.06m | ▲ +6.4% | ▲ +8.1% | ▲ +5.1% | – | – | – | – |
| Boroondara | Surrey Hills | $2.19m | ▼ −0.5% | ▼ −2.4% | ▼ −5.0% | $900k | 0.0% | ▼ −4.8% | ▲ +4.4% |
| Manningham | Templestowe | $1.57m | ▼ −1.9% | ▼ −4.3% | ▼ −4.6% | $982k | ▲ +0.9% | ▲ +6.4% | ▲ +21.2% |
| Manningham | Templestowe Lower | $1.36m | ▼ −0.9% | ▼ −0.8% | ▲ +1.6% | $935k | ▲ +0.3% | ▲ +2.9% | ▲ +5.1% |
| Whitehorse | Vermont | $1.29m | ▼ −1.9% | ▼ −4.3% | ▼ −1.0% | $870k | ▲ +2.2% | ▼ −0.7% | ▲ +1.5% |
| Whitehorse | Vermont South | $1.45m | ▼ −3.9% | ▼ −5.2% | ▼ −3.2% | $1.02m | ▲ +0.5% | ▲ +15.4% | ▲ +5.2% |
| Manningham | Warrandyte | $1.49m | ▼ −0.5% | ▲ +1.9% | ▲ +8.6% | $486k | – | – | – |
| Manningham | Warrandyte South | $2.47m | – | – | – | – | – | – | – |
| Monash | Wheelers Hill | $1.46m | ▼ −2.3% | ▼ −2.5% | ▼ −0.7% | $1.21m | 0.0% | ▼ −3.9% | ▲ +0.8% |
| Manningham | Wonga Park | $1.65m | ▼ −1.3% | ▼ −2.6% | ▲ +8.9% | $1.07m | – | – | – |
Common questions
What is the median house price in Melbourne Eastern Suburbs?
Across the 50 Melbourne Eastern Suburbs suburbs with a reported median house price in October 2026, the middle suburb median is $1.50m. This is the median of suburb medians, not a single city-wide figure.
Which Melbourne Eastern Suburbs suburbs have the highest house prices?
In October 2026 the highest median house prices were in Canterbury ($3.13m), Deepdene ($2.95m), Balwyn ($2.67m), Warrandyte South ($2.47m), Hawthorn East ($2.46m).
Where are the most affordable houses in Melbourne Eastern Suburbs?
In October 2026 the lowest median house prices were in Mulgrave ($1.08m), Notting Hill ($1.17m), Nunawading ($1.18m), Forest Hill ($1.18m), Clayton ($1.19m). Units are often cheaper: the lowest unit medians were in Notting Hill ($432k), Warrandyte ($486k), Box Hill ($500k).
Where does this data come from and how often is it updated?
Prices come from REA sales data and are refreshed monthly. This page covers Box Hill, Doncaster, Glen Waverley, Kew and Camberwell, using ABS 2021 suburb boundaries, and shows October 2026.